A default pairs plot limited to selected variables
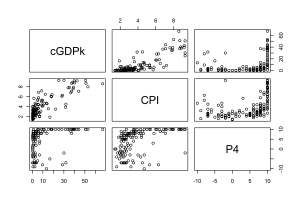

A default pairs plot limited to selected variables
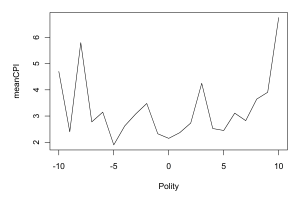
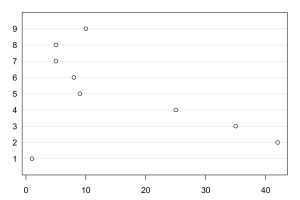
A default line chart showing corruption against polity
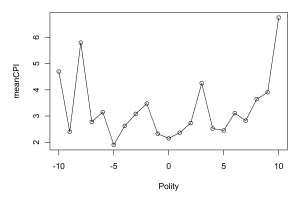
A line plot using lines and point markers
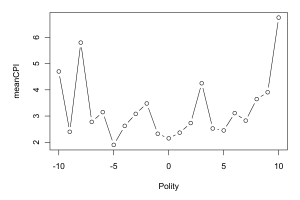
A basic line plot with point markers and broken connecting lines
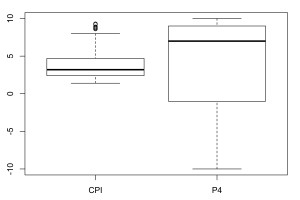
Box plots of corruption and polity scores.
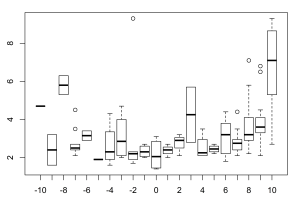
Box plots of corruption levels by categorical values of polity
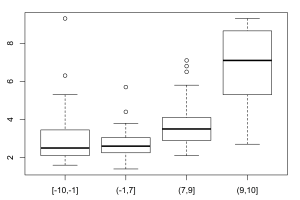
Box plots showing the use of cut-points to aggregate another variable
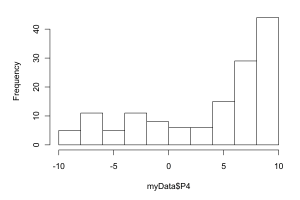
A default histogram with Polity data in bins
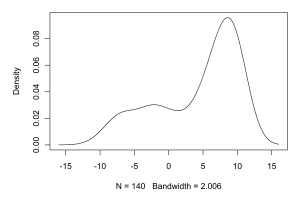
A density plot of Polity values
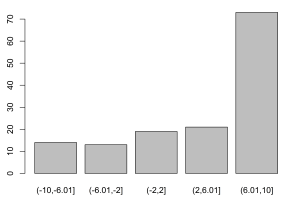
A barplot of polity values
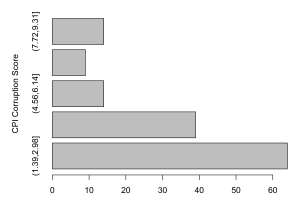
A horizontal barplot to show distribution of corruption scores
A dot chart of CPI corruption scores