A Pie Chart of Corruption Scores
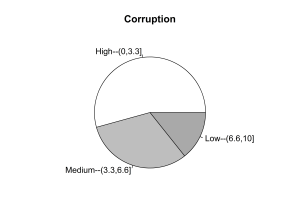

A Pie Chart of Corruption Scores
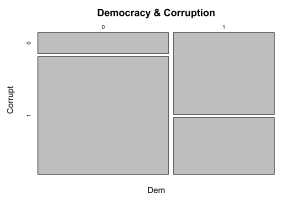
A mosaic plot showing the joint distribution of polity and corruption scores
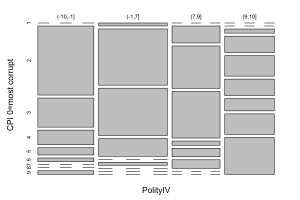
A more complex mosaic plot showing polity and corruption scores
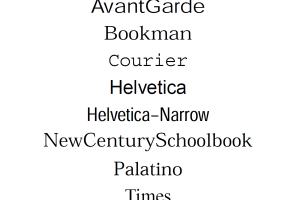
The built-in PDF fonts
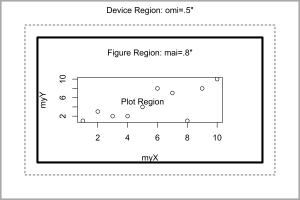
The plot and device regions
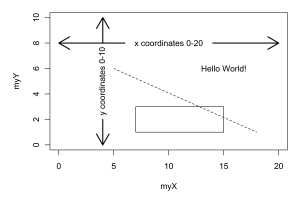
Using the X-Y coordinates for object placement
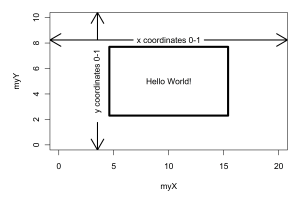
Using proportional coordinates to place objects
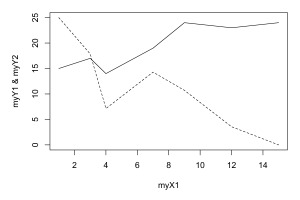
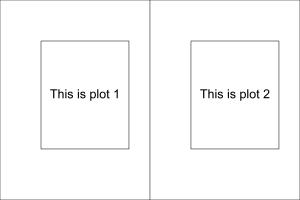
Two plots overlaid in one figure
Placing multiple plots in a grid
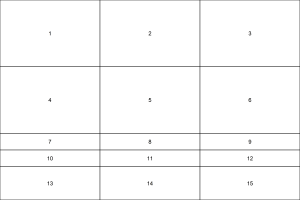
The layout method grid for placing multiple plots
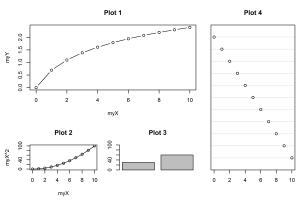
Multiple plots placed with the layout method
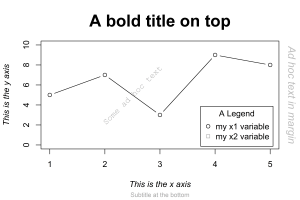
Various text effects in R graphics