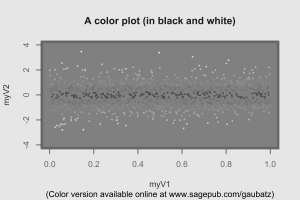
A grayscale plot attempting to demonstrate the use of colors

A grayscale plot attempting to demonstrate the use of colors
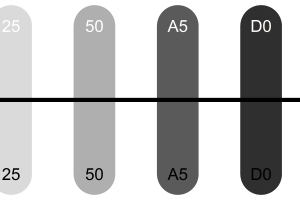
Using transparency effects with colors
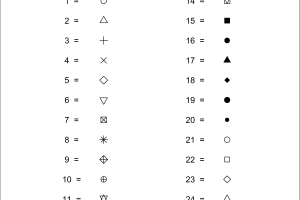
A list of pch= values to set point markers
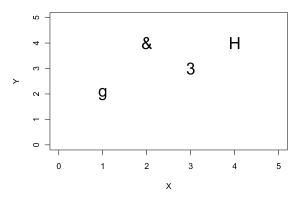
Using alphanumeric symbols as custom point markers
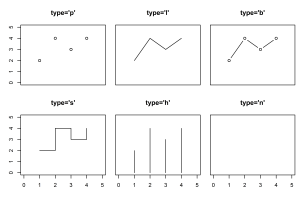
The six line connector styles for the type= option
A demonstration of drawing with the shape symbols
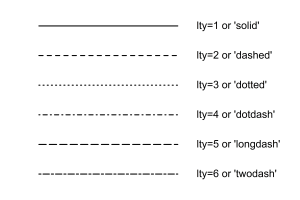
Regular line types available in R graphics
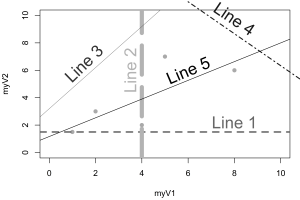
Adding ad hoc lines to an R plot
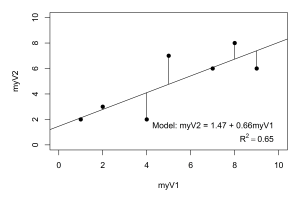
Adding data-based lines to a plot
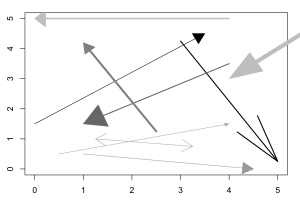
Regular and customized arrows added to a plot
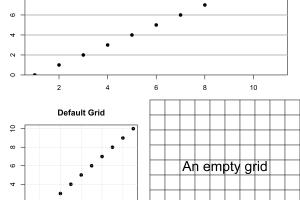
Adding grid lines to R graphics
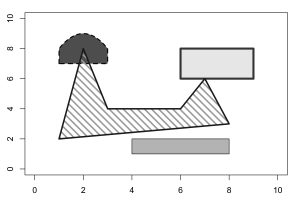
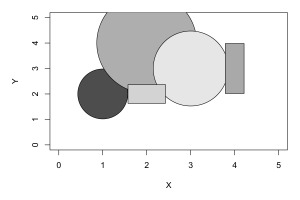
Drawing with polygon shapes