A default scatterplot of two continuous variables (Female life expectancy v. Press freedom)
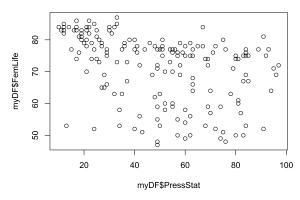

A default scatterplot of two continuous variables (Female life expectancy v. Press freedom)
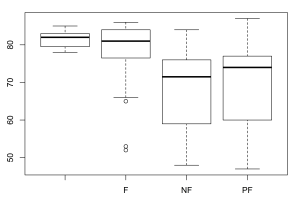
A default bloxpot of a continuous variable (female life expectancy) against a categorical variable (press freedom).
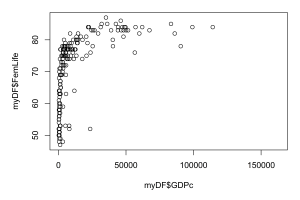
Default scatterplot of female life expectancy as a function of GDP per capita
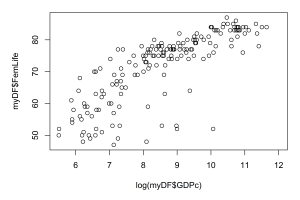
Default scatterplot of female life expectancy as a function of the natural log of GDP per capita.
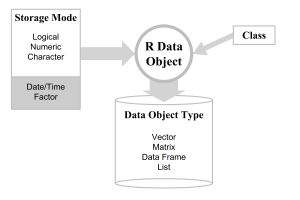
A graphic illustration of my approach to R objects
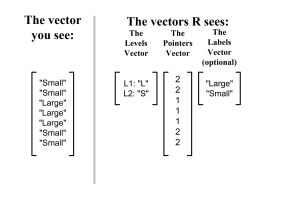
An illustration of the structure of R factor objects.
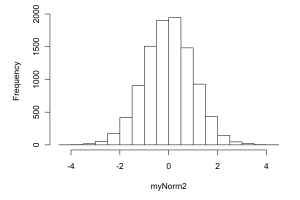
A default histogram of a normal distribution.
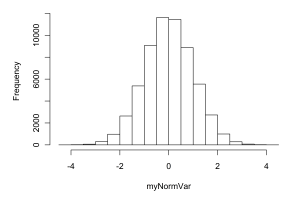
A default histogram of a normal distribution.
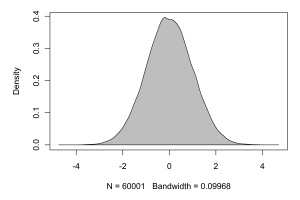
A default kernel density plot for a normal distribution, filled in with gray.
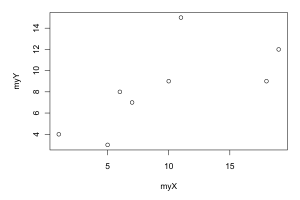
Another simple default scatterplot.
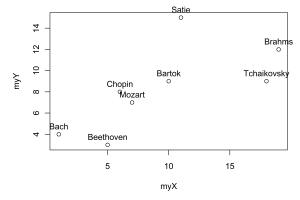
A basic scatterplot adding labels for each observation.
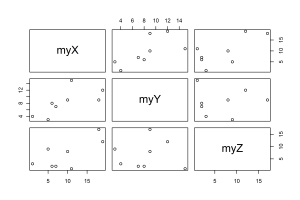
A default pairs plot for three variables.