SGR

SGR

A place for the uninitiated and the unnerved who need to learn R

Menu

  • SGR Home
  • SGR About
  • SGR Code
  • SGR Graphics
  • SGR Data
  • All Graphics
  • /SGR Book Graphics
  • /SGR Color Graphics
  • /The Additional Graphics Examples
  • Demonstration of Positioning Text and Using Plotmath

    Figure 14-13: Positioning Text

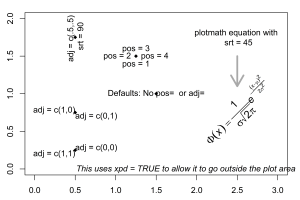
    Positioning text and using Plotmath to print an equation

  • Black and White Plot of Colors

    Figure 15-1: A B&W Plot of Colors

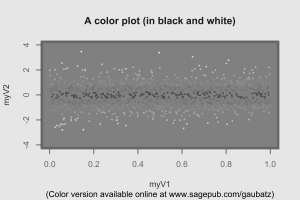
    A grayscale plot attempting to demonstrate the use of colors

  • A Plot with Colors

    Figure 15-1c: A Color Plot

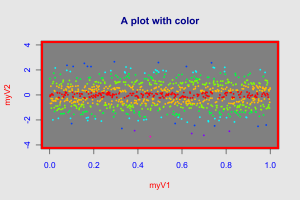
    A color version of the plot showing colors set by random normal deviates

  • Using Color Transparency in R Graphics

    Figure 15-2: Transparency

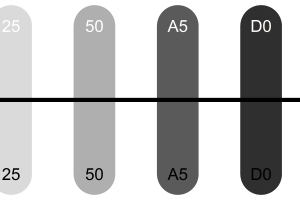
    Using transparency effects with colors

  • Adding Transparency to Colors in R Graphics

    Figure 15-2c: Color Transparency

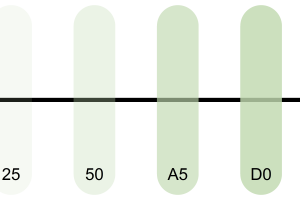
    Adding transparency values to colors in R graphics

  • Point Marker Styles in R Graphics

    Figure 15-3: Point Marker Styles

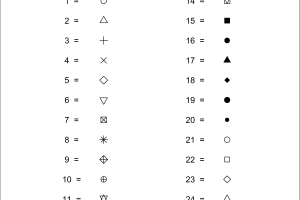
    A list of pch= values to set point markers

  • Using Alphanumerics for Point Markers

    Figure 15-4: Custom Point Markers

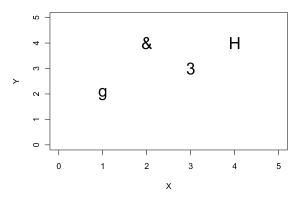
    Using alphanumeric symbols as custom point markers

  • Line Plot Connector Styles in R Graphics

    Figure 15-5: Point Connector Styles

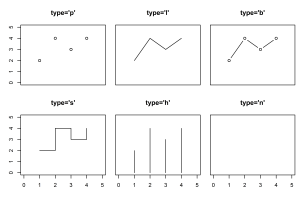
    The six line connector styles for the type= option

  • Drawing with Symbols in R Graphics

    Figure: 15-6: Drawing Symbols

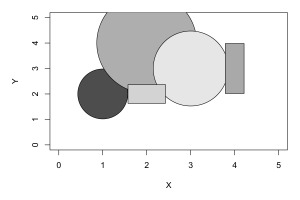
    A demonstration of drawing with the shape symbols

  • Line Types in R Graphics

    Figure 15-7: Line Types

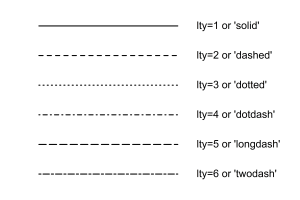
    Regular line types available in R graphics

  • Adding Lines to a Plot in R Graphics

    Figure 15-8: Adding Lines

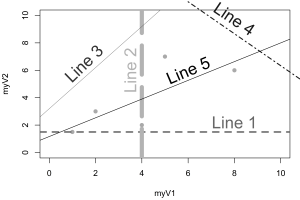
    Adding ad hoc lines to an R plot

  • Adding Lines Systematically to an R Plot

    Figure 15-9: Adding Line Segments

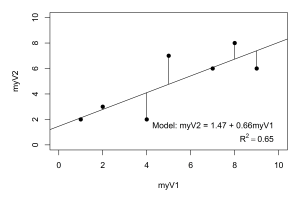
    Adding data-based lines to a plot

  • « Previous
  • 1
  • …
  • 4
  • 5
  • 6
  • 7
  • 8
  • Next »
Proudly powered by WordPress · Theme: Suits by Theme Weaver