The default version of the pie chart (in color)
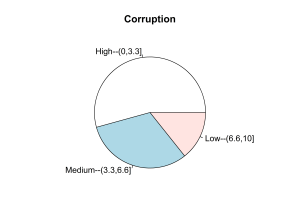

The default version of the pie chart (in color)
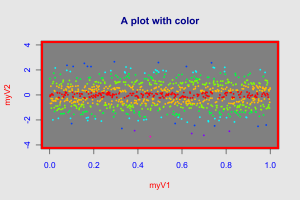
A color version of the plot showing colors set by random normal deviates
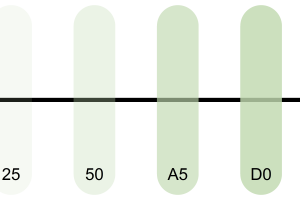
Adding transparency values to colors in R graphics
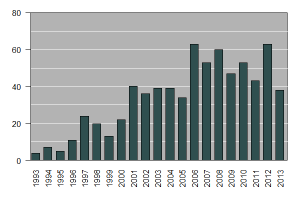
A simple bar chart over a gray background with white horizontal grid lines
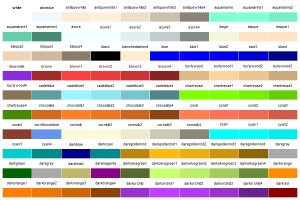
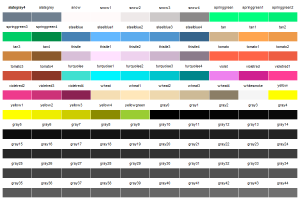
A chart showing R named colors
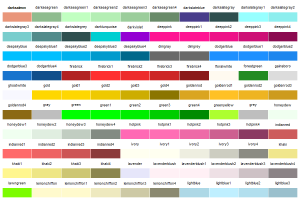
A grid of the second 100 named colors in R
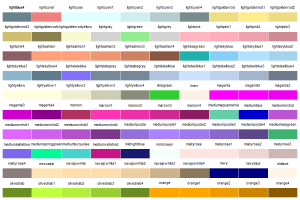
A grid of 100 more R named colors
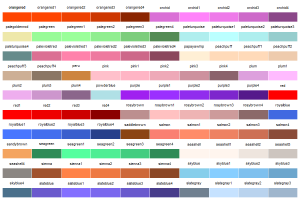
A grid of 100 more named colors in R graphics
Another grid of 100 R graphics named colors
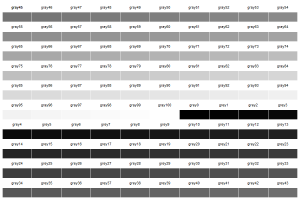
A grid of 100 named gray shades from R graphics
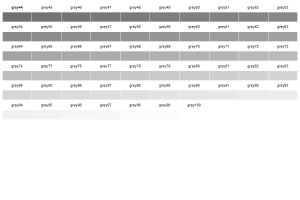
A grid of named R colors, in this case all gray shades