SGR

SGR

A place for the uninitiated and the unnerved who need to learn R

Menu

  • SGR Home
  • SGR About
  • SGR Code
  • SGR Graphics
  • SGR Data

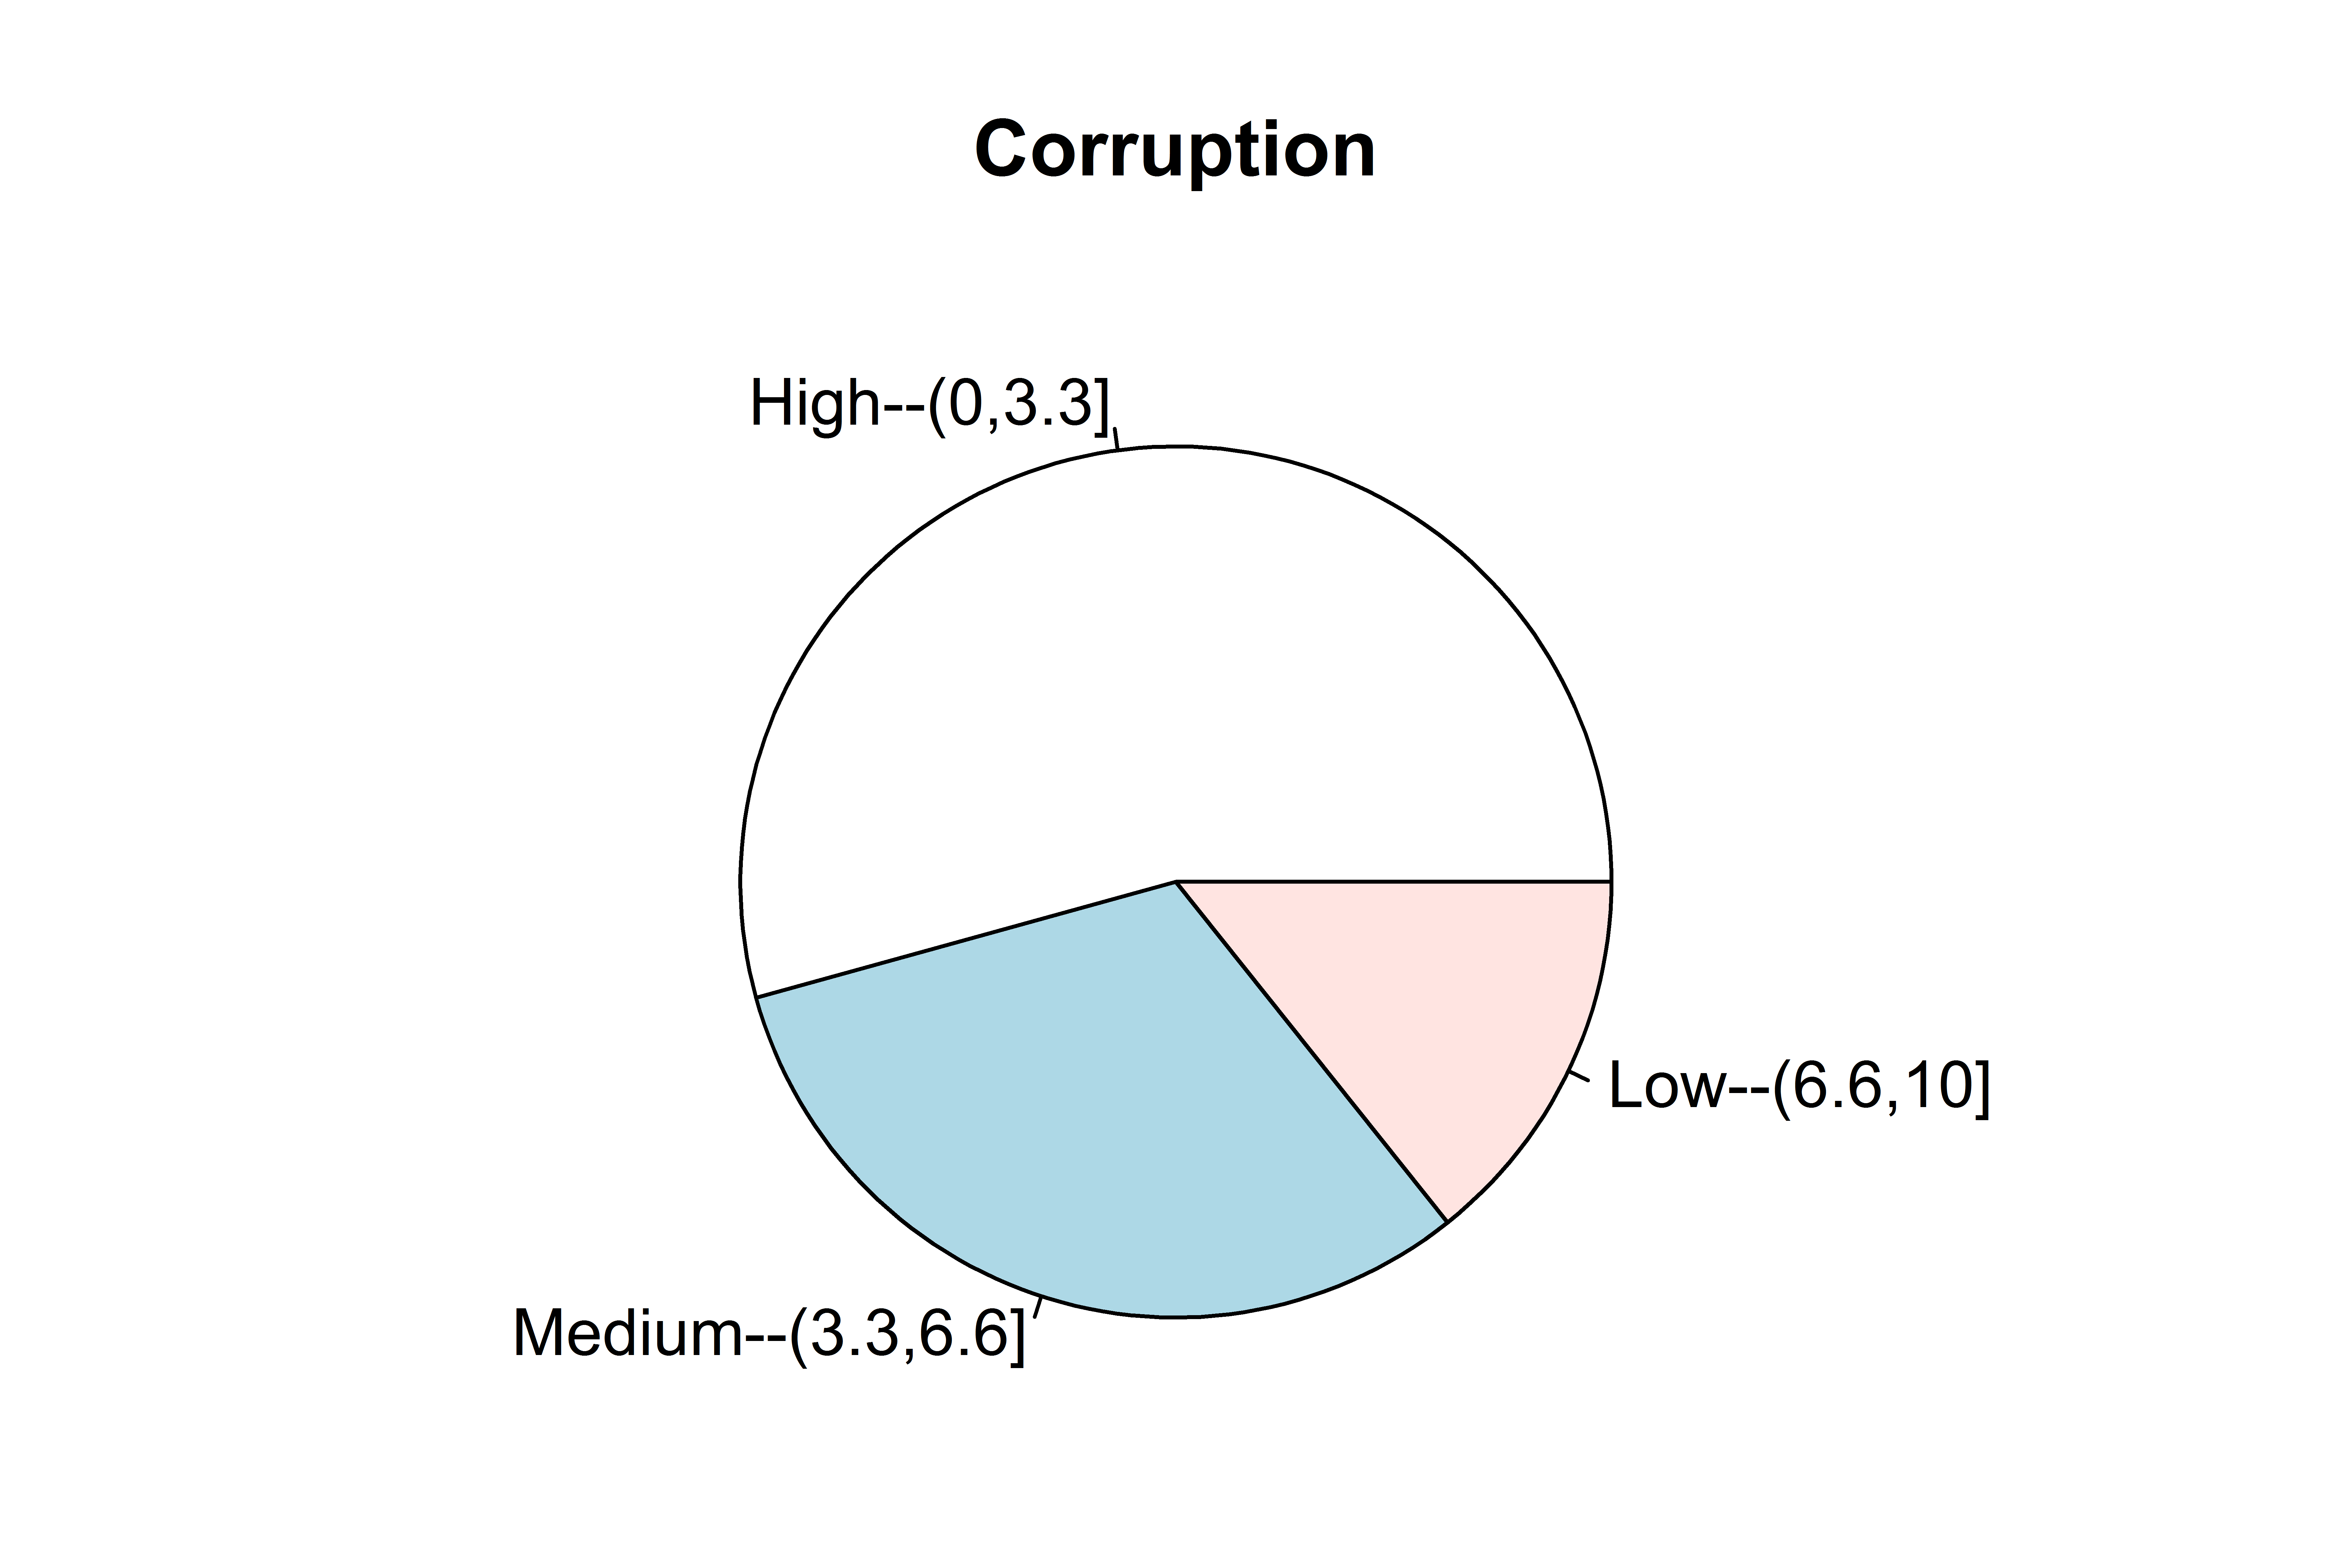
Figure 12-15c: A Color Pie Chart

Portfolio Categories: All Graphics and SGR Color Graphics.

Demonstration of R Graphics Pie Chart

A Pie Chart of Corruption Scores

Post navigation

← Figure 12-16: A Simple Mosaic Plot Figure 12-15: A Pie Chart →

What’s Here

  • SGR Home
  • SGR About
  • SGR Code
  • SGR Graphics
  • SGR Data
Proudly powered by WordPress · Theme: Suits by Theme Weaver