SGR

SGR

A place for the uninitiated and the unnerved who need to learn R

Menu

  • SGR Home
  • SGR About
  • SGR Code
  • SGR Graphics
  • SGR Data
  • All Graphics
  • /SGR Book Graphics
  • /SGR Color Graphics
  • /The Additional Graphics Examples
  • Demonstration of text effects in R graphics

    Figure 14-1: Various Text

    Various text effects in R graphics

  • Demonstration of Built-in R Graphics Fonts

    Figure 14-2: The Built-in Fonts

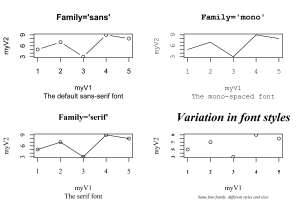
    The built-in font styles in R graphics

  • Demonstration of Windows Fonts in R Graphics

    Figure 14-3: Windows Fonts

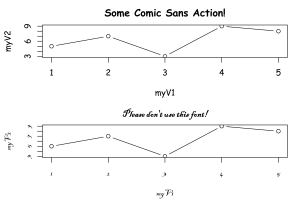
    Using Windows True Type fonts in R graphics

  • Demonstration of Rdevga Method for Fonts

    Figure 14-4: The Rdevga Method

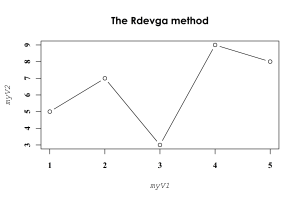
    Demonstration of the Rdevga method to change font styles

  • Demonstration of Titles and Subtitles in R Graphics

    Figure 14-5: Titles and Subtitles

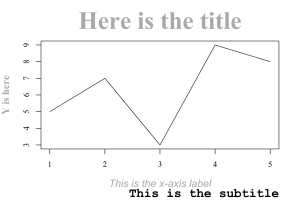
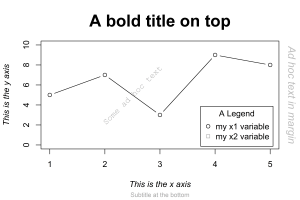
    Setting titles and subtitles

  • Demonstration of Adding Legends in R Graphics

    Figure 14-6: Legends

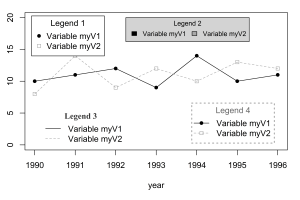
    Adding legends to an R plot

  • Demonstration of Adding a Legend Outside of the Plot Area

    Figure 14-7: External Legends

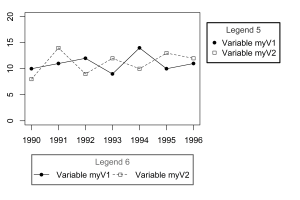
    Adding a legend outside the plot area

  • Demonstration of Custom Axes

    Figure 14-8: Customized Axes

    Setting up custom axes

  • Demonstration of More Customized Axes

    Figure 14-9: More Axis Effects

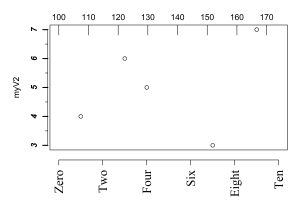
    More customized axis effects

  • Adding Tick Marks to a Custom Axis with R Graphics

    Figure 14-10: Adding Tick Marks

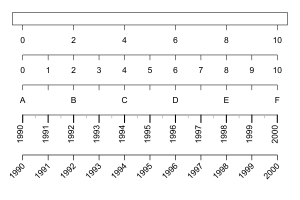
    Adding customized tick marks to an axis

  • Default Date Axis

    Figure 14-11: Default Date Axes

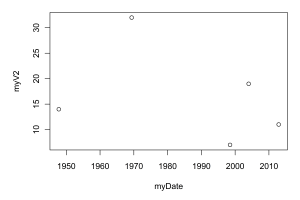
    The default formatting for date axes

  • A Custom Date Axis with R Graphics

    Figure 14-12: A Custom Date Axis

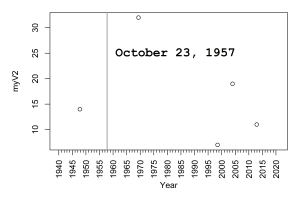
    A date axis with customized formatting

  • « Previous
  • 1
  • …
  • 3
  • 4
  • 5
  • 6
  • 7
  • 8
  • Next »
Proudly powered by WordPress · Theme: Suits by Theme Weaver