Regular and customized arrows added to a plot
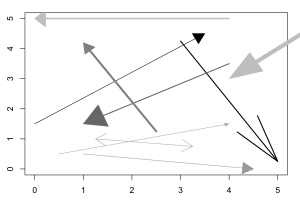

Regular and customized arrows added to a plot
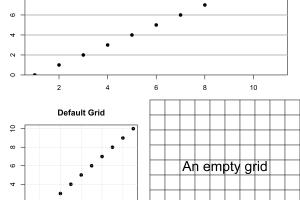
Adding grid lines to R graphics
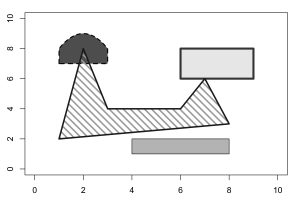
Drawing with polygon shapes
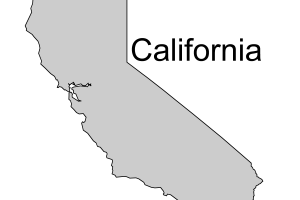
Drawing a polygon based on a shape file
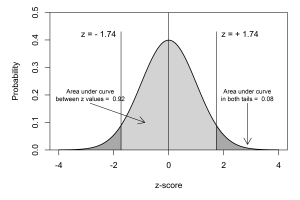
A normal curve drawing with additional placed elements
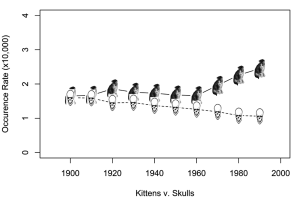
Transparency problems in using images in an R graphic
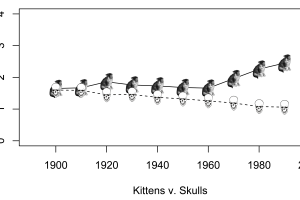
Incorporating drawings with appropriate transparency
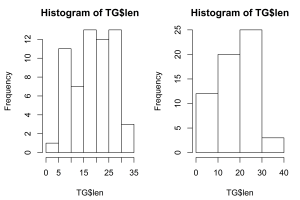
A default histogram and a histogram with set breaks
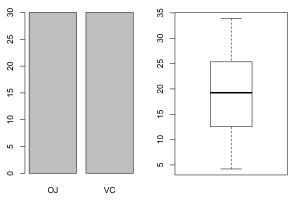
A default histogram from a factor and a boxplot
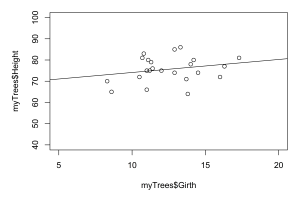
A simple bivariate scatterplot with a regression line
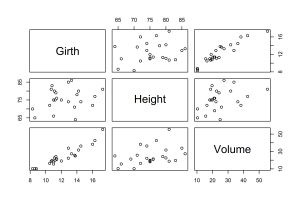
A basic pairs plot of the R trees data
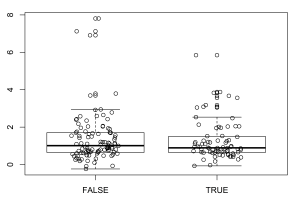
A boxplot of CO2 output for Kyoto signatory and non-signatory states with jittered points